I treat textual data appearing on websites, such as discourse
or descriptors, as qualitative, meaning it is information
that is difficult to measure, count, or express in numerical
terms. Descriptors provide key insight into the scope of
members included within a tribal group website as well as
the level of specificity members use to refer to themselves
within the group. Fuzzy logic is a logical system dealing
with the concept of partial truth with values ranging between
completely true and completely false. This study uses fuzzy
logic to associate specific numerical values with particular
websites to illustrate levels of relational connectivity.
The following description details the processes developed
in the course of this study to measure levels of relational
connectivity between websites, determine degrees of “fuzziness,”
and construct network representations.
This analytical portion of the study remains experimental,
relying upon subjective assumptions regarding the role of
referential tribe-based descriptors within observed websites.
Values are derived from a scale based upon referential specificity,
ranging from 0.0 to 1.0. For instance, discourse and descriptors
within the Amonsoquath
Tribe of Cherokee website (Amonsoquath Tribe, No Date),
which indicate its members identify as part of a specific
tribe within the greater Cherokee nation context, received
a value of 0.9. Conversely, the NativeWeb
(NativeWeb, 2006) website, which often uses the indistinct
“Indigenous” descriptor to refer to its members,
was assigned a value of 0.2 due to its wide scope and ambiguity.
The Caribbean
Amerindian Certrelink website (CAC, 2006) denotes a
slightly more specific “Amerindian” descriptor
and geographic locale, receiving a value of 0.4. The following
table represents the process used to determine the relational
connectivity between these three Native group websites.
The relational connectivity number, or RCN, represents
the degree of connectivity between nodes in a given dataset,
based upon the level of specific ethnic distinction within
each tribal site. A high RCN indicates that nodes exhibit
a high level of tribal specificity, while a low RCN indicates
broader pan-Indian qualities exist between elements in the
dataset. The RCN is determined by dividing the sum of values
of the dataset by the dataset’s cardinality (total
number of element within the set). As shown above, the RCN
for the data set of {A,B,C} is 0.5. The RCN value of 0.5
indicates that there is not a strong relation existing between
this dataset, reflecting the broader, pan-Indian scope of
the NativeWeb and Centrelink sites compared to the tribal
specific Amonsoquath website. Once the initial RCN is found
for a dataset, additional RCNs may be found for the subsets
in order to display the relational bonds across edges within
the dataset. The RCN may be determined for multiple datasets
in order to display the level of connective bonds existing
between much larger groups of data as long as the numerical
values within the scale of referential specificity remains
the same for all of the datasets.
| Website |
RS Value |
| Aboriginal Connections |
0.3 |
| Amonsoquath Cherokee |
0.9 |
| BC First Nations |
0.6 |
| Biloxi-Choctaw |
0.9 |
| Caribbean Amerindian |
0.4 |
| Cherokee NC |
1 |
| Crazy Crow |
0.5 |
| Hopi Tribe |
0.7 |
| Indian Circle Web Ring |
0.5 |
| Kan10 |
0.3 |
| Makah |
1 |
| NativeWeb |
0.2 |
| Red Nation |
0.5 |
| Seminole Tribe of Florida |
1 |
| Tanio-Tribe |
0.8 |
Measuring the degree of “fuzziness” within
a dataset is a powerful tool to analyze relationships existing
between every node, represent points of comparison, and
visualize the relational network. Based upon the concept
of referential specificity, I determined the quantitative
values for each of the fifteen websites originally cataloged
and documented, which are displayed in the chart above.
Substituting these values within the m1 and m2 variables,
I applied the following equation to every relationship existing
within the dataset.
In contrast to the RCN formula, which measures the relational
connectivity within the entire dataset, this equation measures
the degree of relational difference between two websites.
Websites exhibiting similar RS values return an equally
similar value and are grouped together. For example, the
Biloxi-Choctaw (0.9) and Tanio-Tribe (0.8) return a value
of 0.9 indicating tribal specific websites. Likewise, groups
such as NativeWeb (0.2) and Aboriginal Connections (0.3)
also return a value of 0.9, indicating a strong degree of
similarity in regards to exhibition of ambiguous supratribal
descriptors. A diagonal matrix representing the degree of
relation between every website then forms when the fuzziness
measurement formula is applied to the entire dataset (see
Appendix). The diagonal matrix is introduced into Pajek,
an open source network visualization application, where
graphical representations of the websites’ relational
structure are rendered. The following two representations
offer markedly different perspectives on the relational
network.
> 0.9 Threshold
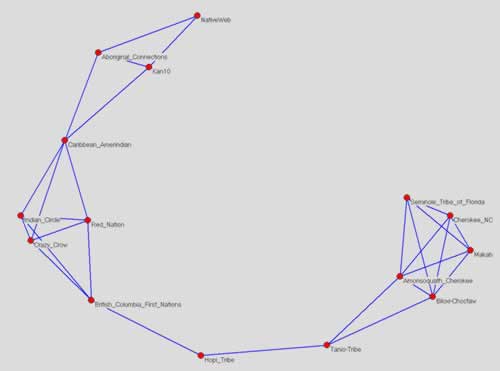
|
In this instance the website network is rendered with a
threshold of greater than 0.9, clearly illustrating the
strongest relational connections—i.e. least degree
of fuzziness—between nodes by severely limiting the
number of edges. Beginning with NativeWeb, the inverted
arc’s nodes increase in referential specificity as
it descends, concluding with a pentagram-esque sub-network
representing websites with the highest RS values. The arc’s
declension represents a symbolic migration from broader
pan-Indian to tribal specific identity. This construction
symbolically illustrates the diversity of scope, referential
descriptors, and ethnic distinction exhibited by websites
encountered in this study.
No Thresholds placed on Network
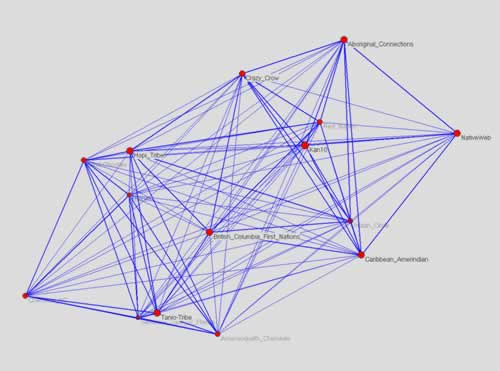
|
This representation displays every possible relational
connection between websites in the dataset. The immense
amount of edges within this matrix of connective links mirrors
the exponentially complex relational structure of websites
on the Internet. I began this portion of my project aiming
to represent purely qualitative data in a quantifiable format,
in hopes of revealing meaningful patterns that previously
would have remained undetected. Although the visualizations
accurately and abstractly illustrate this study’s
data, I was unable to arrive at a definitive method to truly
produce new knowledge. Still, the process itself proved
invaluable to my study, providing an alternate paradigm
to consider how these groups are related rhetorically and
structurally. The visualizations are physical representations
of the intangible communicative space that is the Internet.
This functionality alone provides insight into the formation
of a broader community structure within a virtual context.
Similarly, the varying degrees of relation between nodes
in these representations present a framework to view pan-Indianism’s
emergence online. Although all tribal websites are not directly
related, they remain connected in some sense, providing
a context for participants to identify with and ascribe
to representations on multiple domains. This area of the
study remains experimental, however the cognitive processes
it required profoundly impacted the project as a whole,
providing a meaningful contextual lens to view collected
data and key concepts central to this study.
|